
Profiling
Rstest provides various tools and methods to analyze the performance of test runs, helping you identify and resolve performance bottlenecks.
Using Agent Skills
If you are using a Coding Agent that supports Skills, install the rstest-debugging skill to debug Rstest issues systematically, including performance regressions. Use this skill when Rstest is slower than expected, slower than Jest or Vitest, or when you need to determine whether the bottleneck is in build startup or test execution before trying config or code changes.
After installation, let the Coding Agent help you investigate performance issues.
Common performance bottlenecks
When a test run becomes noticeably slower, first determine whether the bottleneck is in the build stage or the test execution stage:
- If startup takes a long time and reruns remain slow after a small code change, the bottleneck is usually in the build stage.
- If tests begin quickly but individual test cases or test files take a long time to finish, the bottleneck is usually in test execution.
These two categories can then be investigated separately for build versus test execution.
To measure that split instead of inferring it, run the suite once with --trace.
Investigating build performance
For projects using browser-like environments such as jsdom or happy-dom, the build stage is one of the most common bottlenecks. In these environments, rstest bundles third-party dependencies from node_modules by default instead of externalizing them like it does in the node environment.
As a result, test performance can degrade when:
- A test entry indirectly pulls in a large UI library, charting library, or editor package.
- The test only needs a small subset of DOM functionality, but the bundle includes a large amount of third-party runtime code.
For these cases, the following workflow is a practical way to narrow down build-related slowdowns.
1. Enable rstest debug output
Run rstest with DEBUG=rstest:
With DEBUG enabled, rstest prints more detailed build logs and writes temporary build artifacts to disk. By default, they are written to dist/.rstest-temp; if you configure output.distPath.root, they are written to that directory instead.
At this stage, focus on two signals:
- Whether the logs spend a long time in build-related stages.
- Whether the temporary output directory contains unusually large artifacts.
If bundle size is already the primary suspect, this step often provides enough evidence for an initial conclusion.
2. Identify size overhead introduced by third-party dependencies
In jsdom, happy-dom, and similar browser-like environments, large temporary outputs are not surprising because rstest bundles third-party dependencies by default.
In particular, check the following:
- Whether a large artifact maps back to a specific test entry or dependency chain.
- Whether a heavy package from
node_modulesis being pulled in. - Whether the test only needs a small API surface while the entire package is being bundled.
If the problem is concentrated in third-party dependencies, adjusting the bundling strategy is usually more effective than immediately introducing heavyweight profiling tools.
3. Use output.bundleDependencies to validate the bundling strategy
Set output.bundleDependencies to false so browser-like environments externalize third-party dependencies like the node environment:
Then rerun with DEBUG=rstest and compare the following:
- Whether build time drops noticeably.
- Whether the temporary artifacts under
dist/.rstest-tempbecome much smaller.
If both improve, the primary bottleneck was likely the cost of bundling third-party dependencies.
4. Use output.externals for fine-grained control
If you do not want to disable bundling for all third-party dependencies, use output.externals to externalize only selected heavy packages:
This approach is a better fit when:
- Only a few packages are disproportionately large.
- You still want to keep bundling for the rest of the dependency graph.
- You have already confirmed that the bottleneck is concentrated in a small set of third-party packages.
5. Use Rsdoctor when the build bottleneck is still unclear
Once you know the slowdown is in the build stage but still do not know whether the cost comes from entries, loaders, plugins, or a dependency chain, Rsdoctor becomes much more effective. The earlier steps help determine whether the problem is related to bundle size, while Rsdoctor helps identify how compile time is distributed.
output.bundleDependencies: false only applies to non-browser mode. In browser mode, dependencies are always bundled, so this path is not available for reducing bundle size.
Investigating test execution performance
Once the problem has been narrowed down to the test execution stage, the main question is no longer bundle size, but which test file, which test case, or which part of the runtime is consuming the time.
1. Use the verbose reporter to inspect file-level and case-level duration
With verbose reporter enabled, you can directly inspect the execution time of each test file and individual test case. This is usually the first step for execution-stage troubleshooting because it helps narrow the problem down to a specific file, a group of tests, or a small set of cases.
2. Break the run down by phase, suite, and case
Rerun the same tests with --trace. Its summary ranks the slowest phases, files, and test cases, which usually tells you whether the cost sits in build-related phases, in setup files, or in the test bodies.
3. Inspect detailed time distribution after narrowing the scope
Once the slow tests have been identified but the actual runtime cost is still unclear, drop down to a profiler. See Profiler for picking between samply and Node.js profiling.
Using --trace
--trace breaks a run into per-phase, per-suite, and per-case slices. Use it when the reporter's single Duration number is not enough to tell where the time is spent.
The flag is opt-in. Each run records per-suite and per-case slices annotated with status and retry count, a heap counter sampled at each phase boundary, and one slice per phase of every test file:
prepare: set up the worker runtime, the global API, and the coverage provider when coverage is enabled. It is entered twice per test file, before and afterenvSetup.envSetup: install the test environment. Close to zero fornode, and when a non-isolated worker is already pinned to the environment.load: receive the built assets of the test entry. The host-side cost of producing them is reported as a host span instead.setupFiles: evaluate the configured setup files.collect: evaluate the top-level code of the test file.describebodies are deferred and run intests.tests: build the suite and case tree, then run the cases and their hooks.coverage: collect coverage data from the provider. Absent when coverage is disabled, or when the file bailed or threw before this point.teardown: clean up the coverage provider and the worker state, plus the test environment whenisolateis enabled.
Browser Mode records only prepare and tests, measured on the host from the messages the page sends.
Rstest writes two files to <rootPath>/.rstest/, and replaces them on every watch rerun:
trace-<timestamp>.summary.md: a markdown summary ranking the slowest phases, files, and test cases. The same content is printed to the terminal.trace-<timestamp>.json: a Perfetto-compatible trace for the visual UI.
Start with the summary. Open the trace when you also need to see how work overlapped across workers.
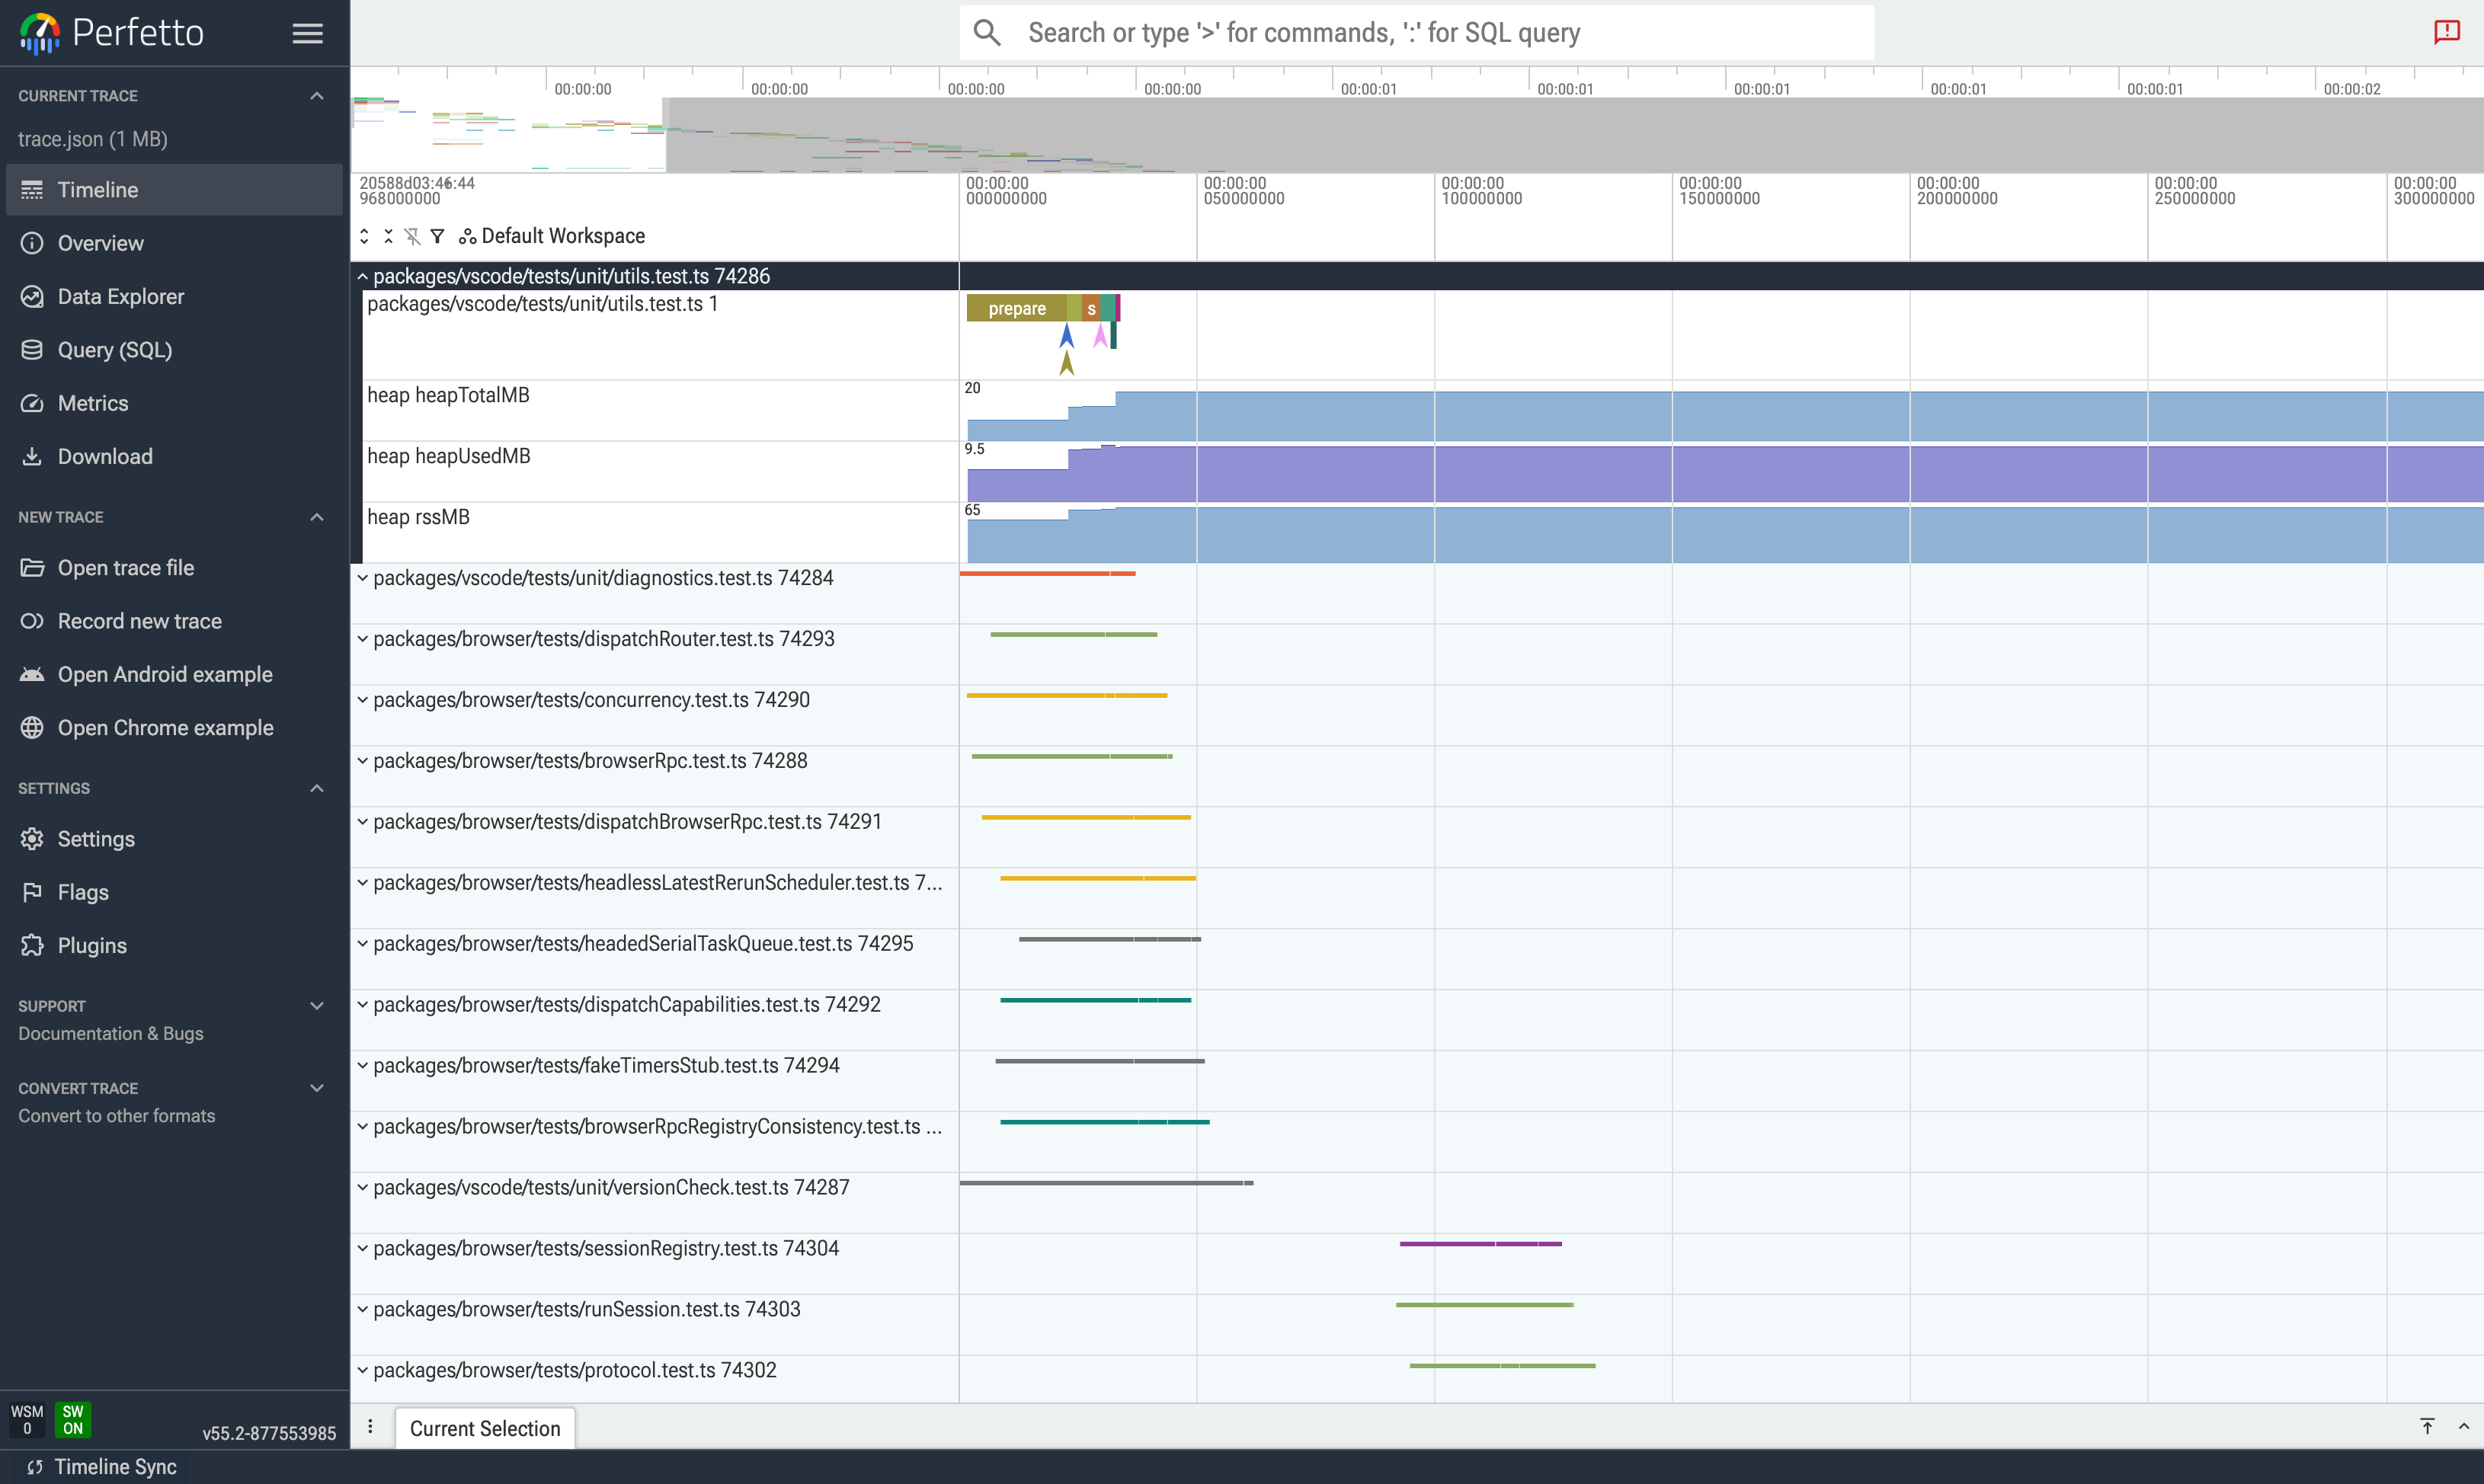
In a TTY, Rstest starts a local helper server so that the printed link opens the trace directly in the Perfetto UI. In CI, the helper server is not started. Upload the trace file as an artifact and drag it into ui.perfetto.dev instead.
To investigate a slowdown with a Coding Agent, hand it both files: the summary for the ranking, the trace for the full event data. They pair with the rstest-debugging skill.
Using Rsdoctor
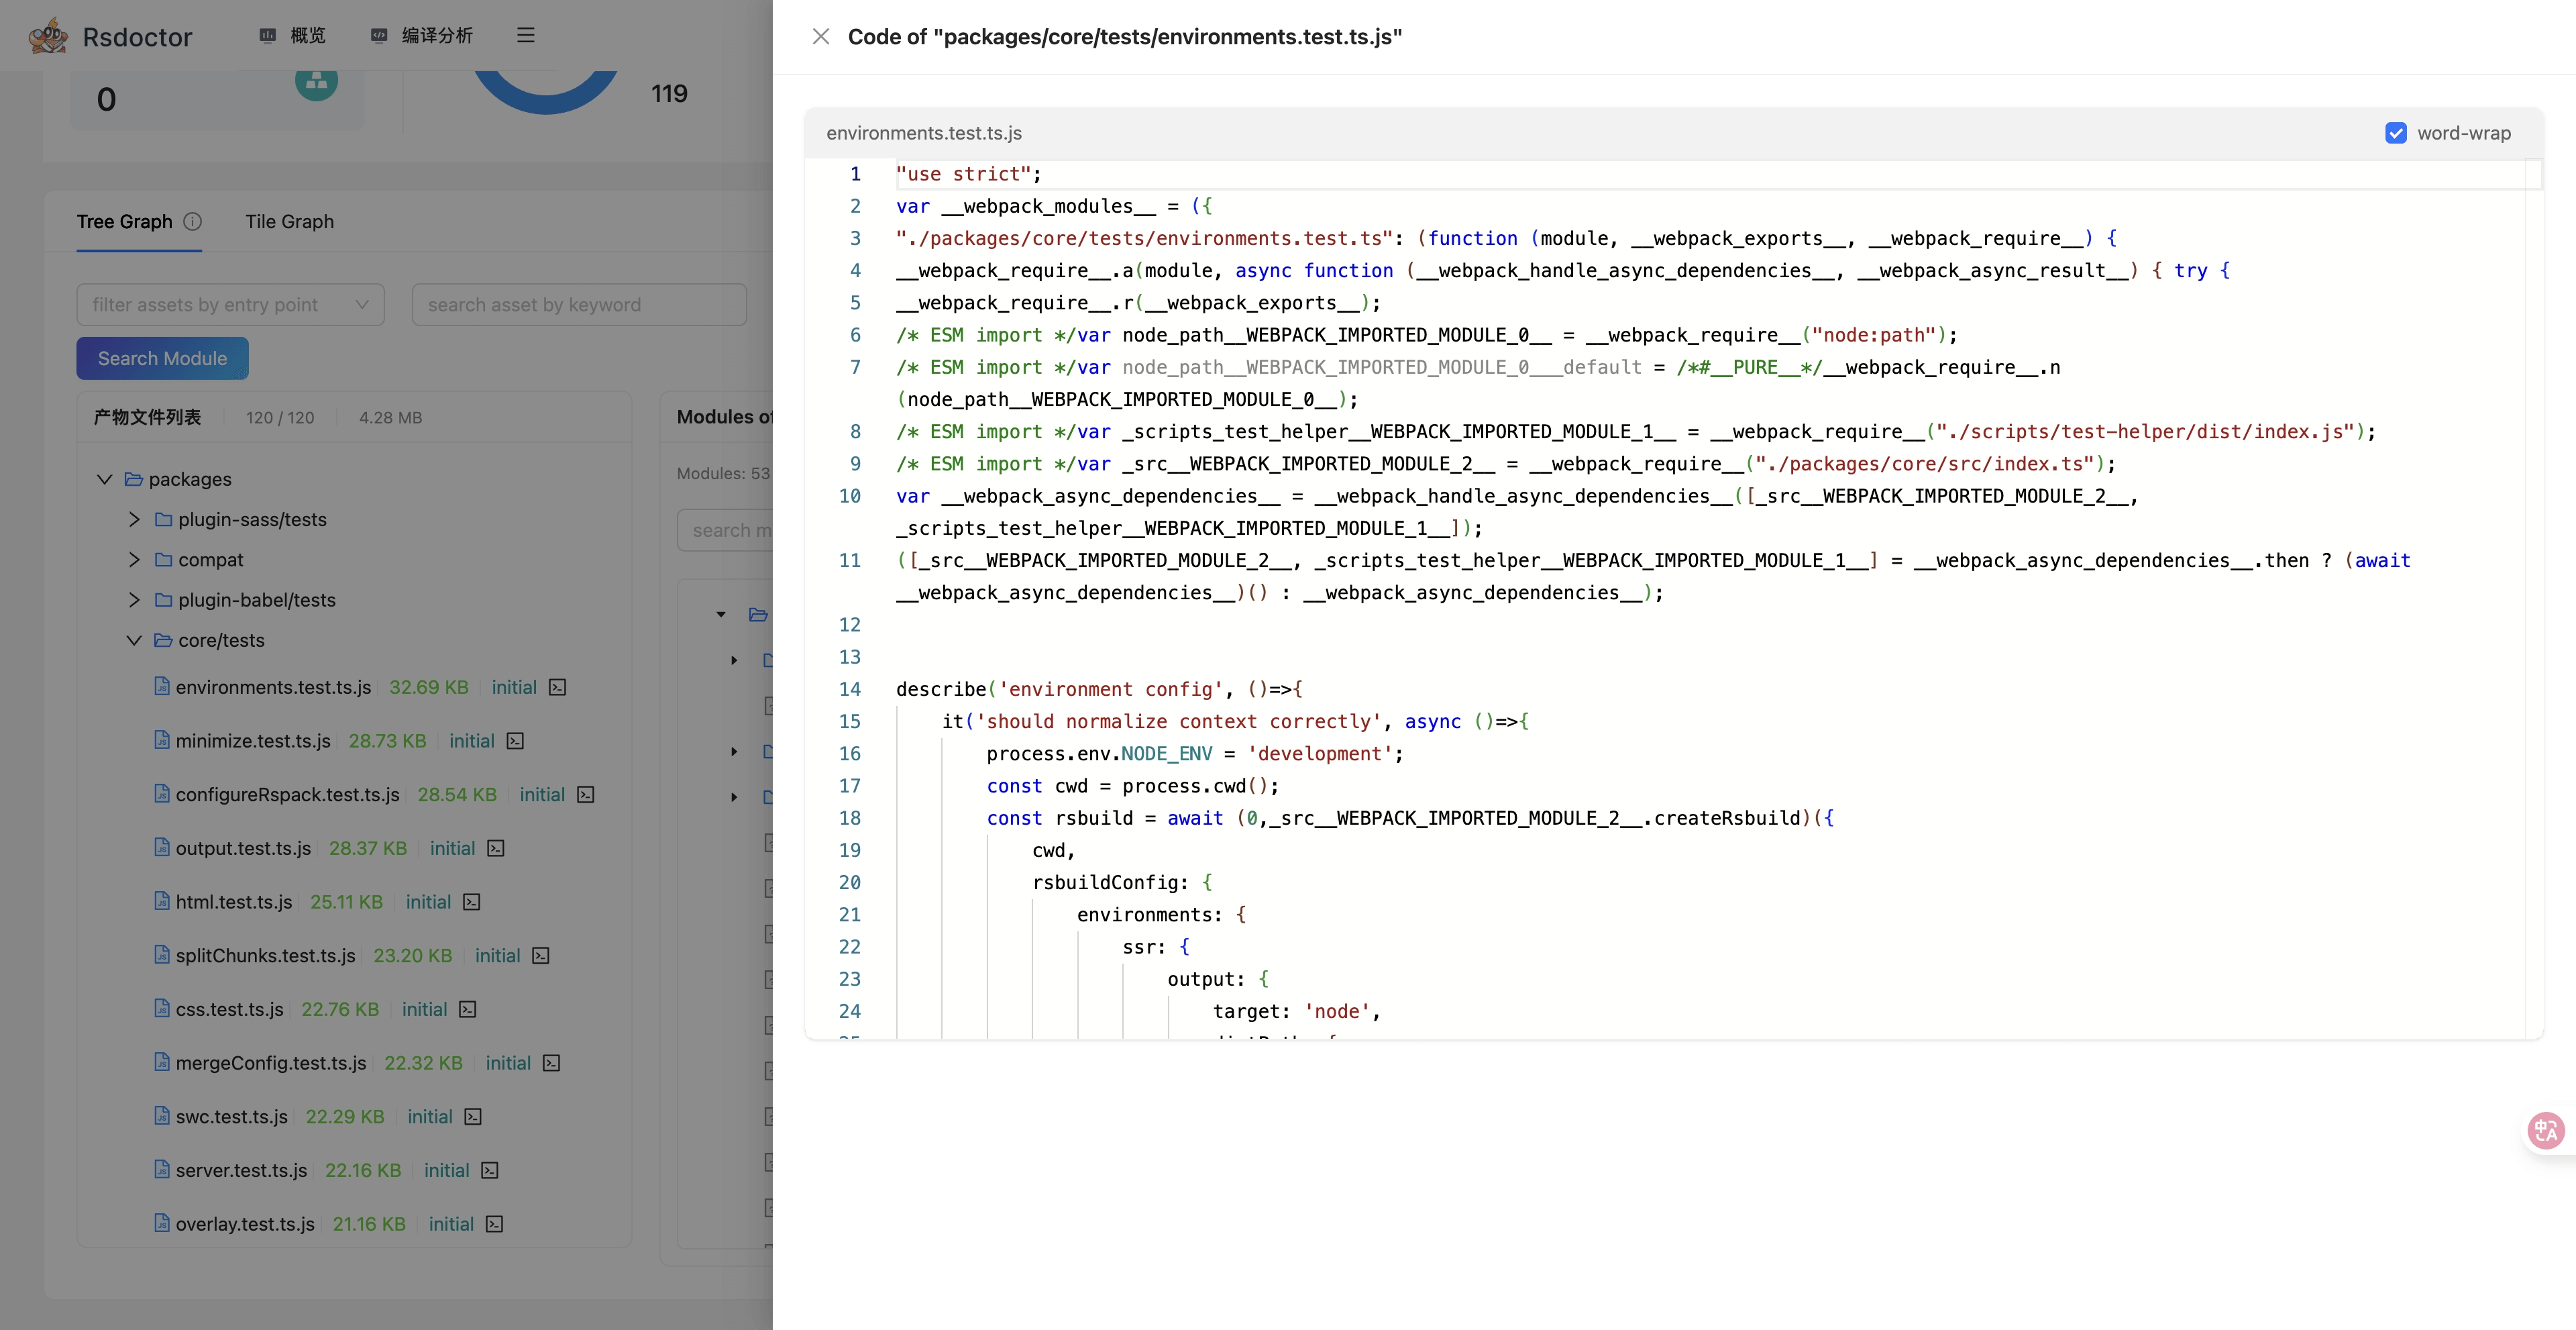
Rsdoctor is a build analysis tool that can visually display the compilation time of each loaders and plugins.
When you need to debug Rstest's build outputs or build processes, you can use Rsdoctor for troubleshooting.
Quick start
In Rstest, you can enable @rsdoctor/core analysis as follows:
- Install Rsdoctor:
- Add
RSDOCTOR=trueenv variable before the CLI command:
As Windows does not support the above usage, you can also use cross-env to set environment variables. This ensures compatibility across different systems:
After running the above commands, Rstest will automatically register the Rsdoctor plugin, and after the build is completed, it will open the build analysis page. For complete features, please refer to Rsdoctor document.
Profiler
Choose a profiler based on what you need to analyze. Check whether --trace already answers the question first, since it requires no external tool.
- CPU time distribution: use samply (recommended). It profiles the rstest main process and worker forks together.
- Memory allocation: use
--heap-prof. See Node.js profiling. samply does not collect memory data. - Step-through debugging: use
--inspect. See Node.js profiling.
Using samply
Note: In order to be able to profiling the Node.js side code in macOS, Node.js v22.16+ is required.
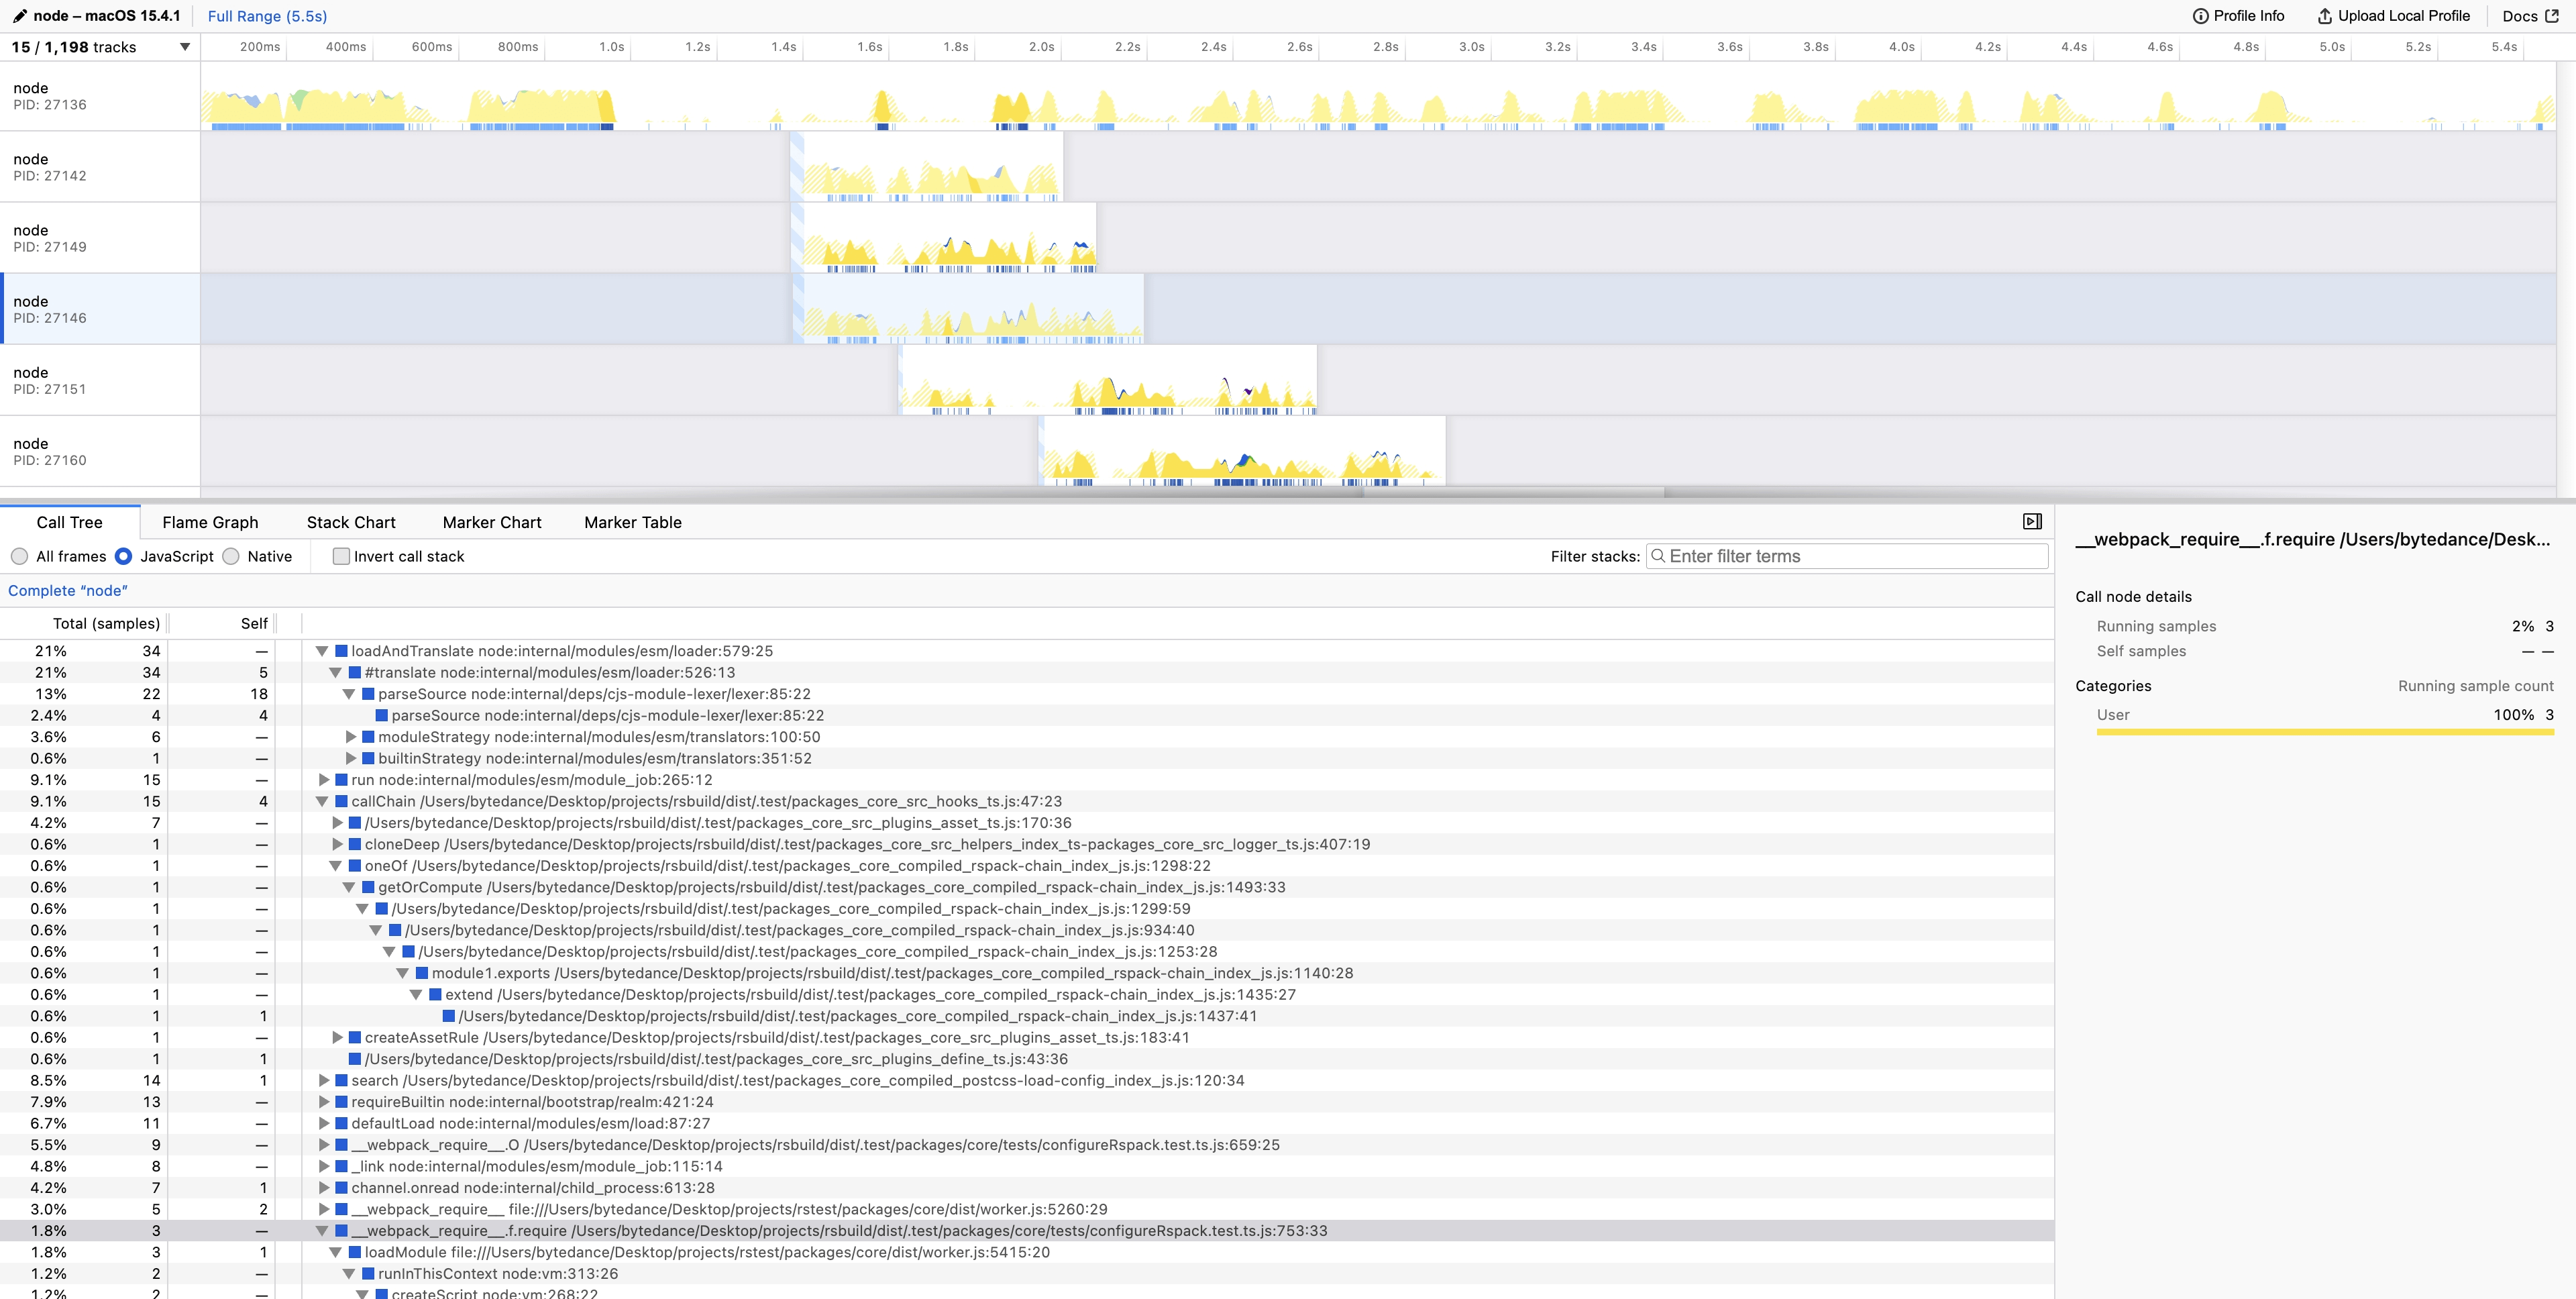
Samply supports performance analysis for both Rstest main process and test process simultaneously. You can perform a complete performance analysis through the following steps:
Run the following command to start performance analysis:
After the command execution, the analysis results will automatically open in the Firefox Profiler.
Rstest’s JavaScript typically runs in the Node.js thread. Select the Node.js thread to view the time distribution on the Node.js side.
Node.js profiling
You can also use Node.js built-in profiling tools to analyze Rstest's performance.
For example, you can use the --heap-prof flag to enable heap profiling:
The heap profile files will be generated in the ./heap-prof directory. You can analyze these files using tools like Visual Studio Code or Chrome DevTools.
You can also use the --inspect flag to enable Node.js inspector.